
Zenopix Explorer
Online (Ethernet) – RF485 RDM Management Software
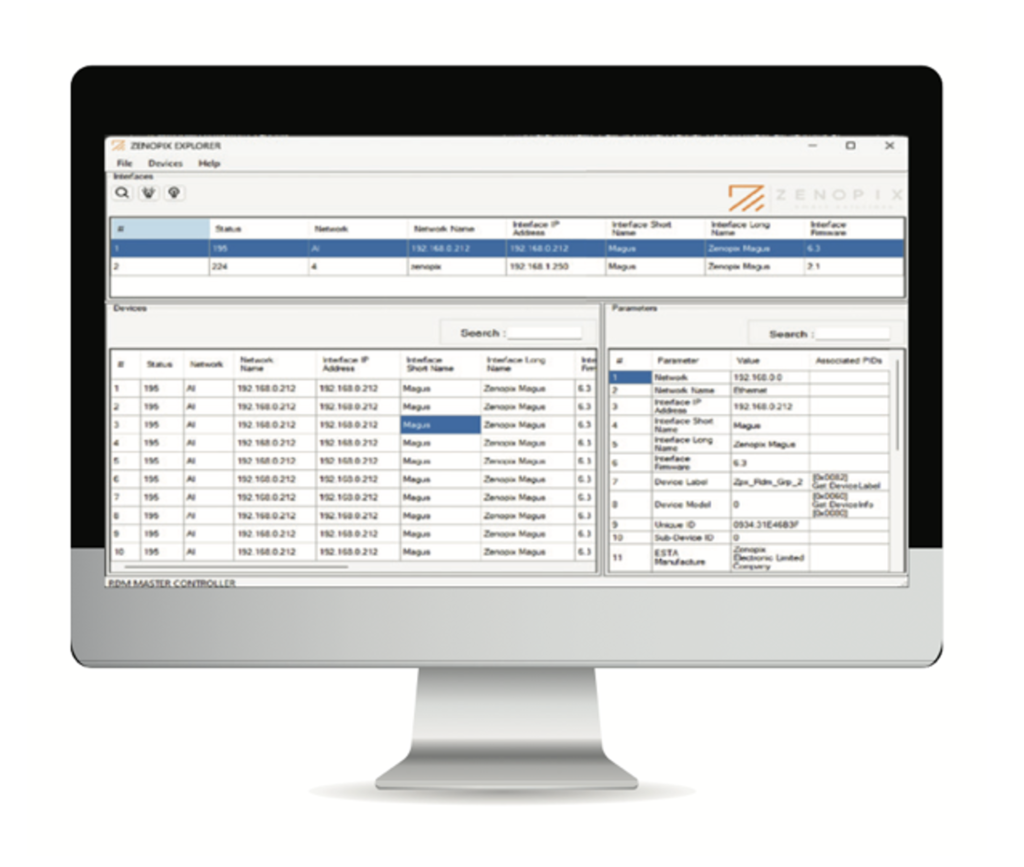
Zenopix Explorer is a professional network management and RDM configuration software designed to work seamlessly with Zenopix Magus hardware. From automatic device discovery and remote parameter configuration to RDM addressing and real-time monitoring, Explorer brings every aspect of your lighting network into one intuitive interface.
Whether you’re managing architectural lighting, entertainment venues, or large-scale pixel installations, Zenopix Explorer helps you deploy faster, manage more efficiently, and maintain complete control over your projects.
Key Features
Zenopix Explorer combines intelligent device discovery, advanced RDM configuration, and real-time network monitoring in a single, intuitive platform. Automatically detect all Zenopix Magus devices on your network, remotely address and configure RDM-compatible fixtures, and monitor critical parameters such as temperature, supply voltage, communication status, signal quality, and network traffic in real time. With centralized management, batch configuration, and remote parameter updates, Explorer simplifies commissioning, reduces maintenance costs, and provides efficient control for lighting projects of any scale.
Comprehensive DMX/RDM Network Management Hub
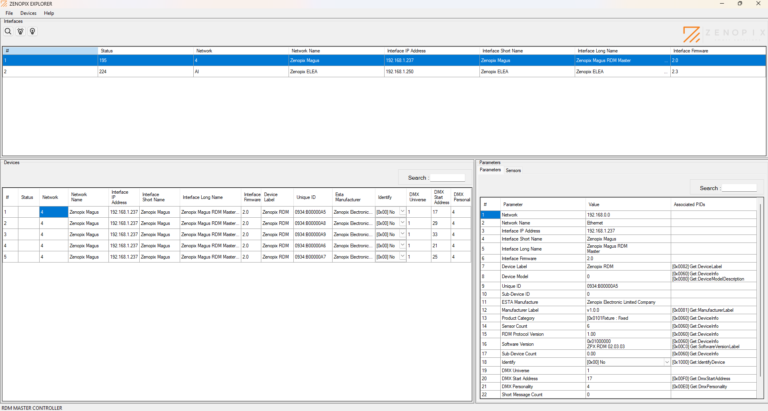
Zenopix Explorer is an advanced desktop software that allows you to manage all RDM (Remote Device Management) supported devices in your professional lighting network with full control from a single screen. By simplifying complex DMX/RDM infrastructures, it transforms device discovery, parameter configuration, and network monitoring processes into a seamless experience.
Advanced Device Discovery and Listing
Scan and list all RDM devices connected to the selected interface within seconds. Instantly access critical device information, including Unique Identifiers (UIDs), ESTA manufacturer data, DMX universes, and DMX start addresses. Use the “Identify” feature to easily locate and identify devices physically in the field.
In-Depth Parameter and PID Control
Dive into every detail of your devices. Through the detailed “Parameters” panel, read and edit key features such as Device Labels, Sensor Counts, Software Versions, and DMX Personalities. The system supports both standard and custom PIDs through Get/Set operations, giving you complete control over your hardware.
Real-Time Sensor Monitoring and Hardware Analysis
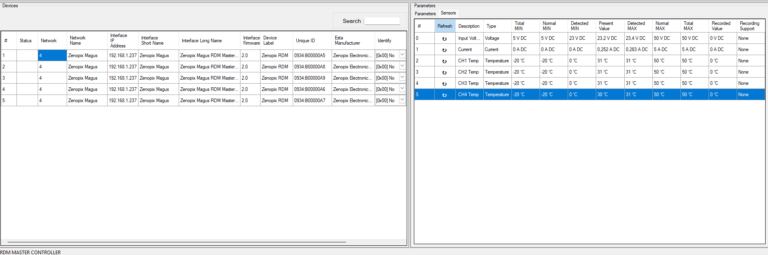
Monitor the real-time performance and hardware health of your RDM devices in the field. Zenopix Explorer’s advanced “Sensors” module brings the physical status of every connected lighting fixture directly to your screen, helping improve overall system stability. Versatile Sensor Readings: Monitor data such as Input Voltage, Current, and independent Channel Temperatures (CH Temp) simultaneously.
Comprehensive Limit and Threshold Monitoring
Analyze the device’s hardware limits (Total MIN/MAX), safe operating ranges (Normal MIN/MAX), and detected extreme values (Detected MIN/MAX) side by side in a single table. Real-Time Data Refresh: Instantly refresh sensor data during critical moments or system testing to detect potential fluctuations.
Smart Sorting and Automatic DMX Addressing (Universe / Port Editor)
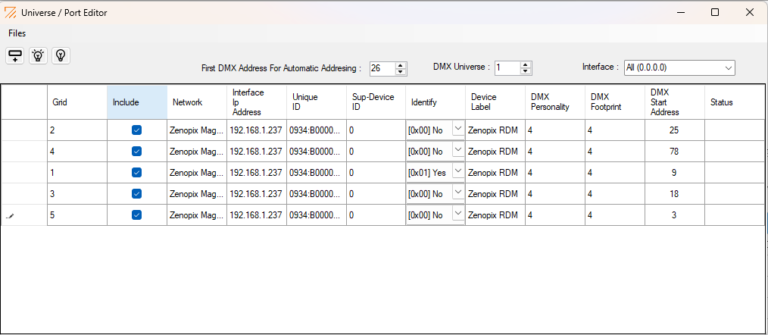
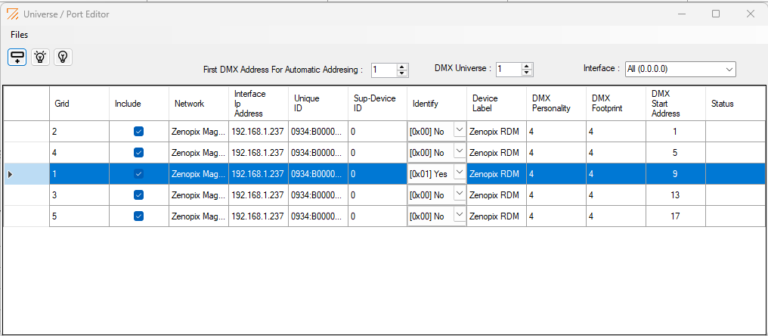
In large-scale projects, manually addressing hundreds of devices can be time-consuming. The Universe / Port Editorallows you to sort and automatically address your devices according to their physical arrangement within the project, significantly speeding up the commissioning process. Dynamic Calculation Based on DMX Footprint: The software automatically detects how many channels each device occupies. When you assign “1” to the first device, the system automatically continues the addressing sequence as “5, 9, 13” for 4-channel fixtures, ensuring fast and accurate DMX addressing.
Eliminate Address Conflicts: Transform complex and manually assigned addresses into an organized, sequential, and conflict-free structure within seconds. Flexible Universe-Based Management: Apply independent automatic addressing scenarios for different DMX universes and freely select which devices to include using the “Include” checkboxes.
Historical Sensor Logging and Graphical Analysis
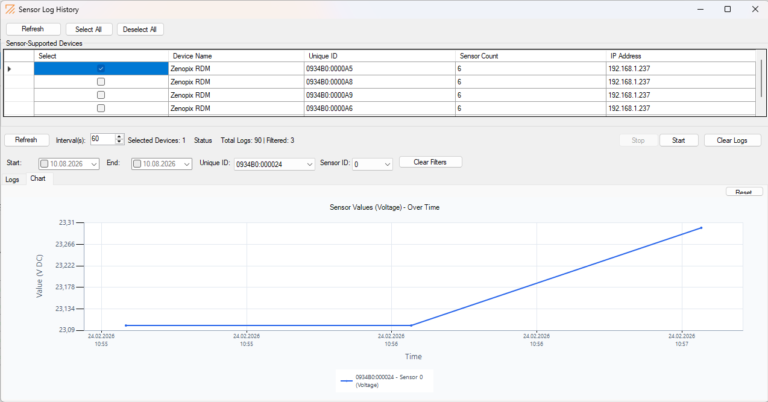
Long-term system reliability depends on analyzing historical data. The Sensor Log History module records sensor data at user-defined intervals and transforms it into meaningful visual charts.
Customizable Data Logging
Set the data collection interval in seconds according to your project requirements.
Interactive Graphical Display
Instead of raw data, monitor voltage or temperature fluctuations at a glance through dynamic Line Charts displayed along a timeline.
Advanced Filtering
Filter records by date, UID, or Sensor ID to detect voltage drops and overheating before hardware failures occur.